
![]() 匯東華統計顧問有限公司
匯東華統計顧問有限公司
"匯東華-認真作好每件事"
~統計,不再是阻力,而是助力~
![]()
BMJ小小統計問題(2):連續性變項資料的呈現
出處:BMJ Statistics Notes Series
前言
British Medical Journal,英國醫學期刊(簡稱 BMJ),創始於1840年,在醫學研究領域享有盛名。本系列匯東華精選BMJ所發行之3百多題Statistical Question,採用中英對照有興趣的朋友們可進行回答。各題都有詳細說明。
完整合輯請見官網/學習專區/BMJ小小統計問題
問題
BMJ 統計問題(2):如何開始探索連續性變項的分佈?
How would you best begin to explore the distribution of a continuous variable?
- Scatter plot(散佈圖)
- Box plot(箱型圖)
- Histogram(直方圖)
- Hypothesis test(假設檢定)
答案
答案是 C:Histogram(直方圖)
詳細說明
散佈圖通常用來顯示兩個連續性變項間的相關,其一為X軸數值,另一個為Y軸數值。雖然單維度散佈圖也可能用來呈現單一連續性變項的分佈,但有個缺點在於當許多資料點很接近時,在判讀上會產生困難。
Scatter plots usually display the relation between two continuous variables plotted on the x and y axes. A one way scatter plot may be used to display a single continuous variable, but a disadvantage is that the plot may be difficult to read if too many points lie close together.
箱形圖僅能顯示資料的摘要,而有關分佈形狀的某些資訊是模糊不清的。如,箱形圖可以從第25個百分位數延伸到第75個百分位數,其中包括一個代表中位數的線。可以添加從箱子延伸出來的線("鬍鬚")以顯示分佈的極端值。
Box plots display only a summary of the data, and some of the information about the shape of the distribution is obscured. For example, a box plot may extend from the 25th centile to the 75th centile and contain a line representing the median. Lines projecting out from the box may be added ("whiskers") to show the extremes of the distribution.
直方圖也許是用來顯示連續性資料(如身高)或間斷性資料(如死亡率)最常用的圖示法。水準軸顯示每個區間使用的組距。對於每個區間,繪製一個以中點為中心的矩形柱,連接水準準軸上升。縱軸顯示落於該區間的個數值,或者,如果需要,也可顯示落於該區間的百分比。
A histogram is perhaps the most commonly used graphical method of displaying either continuous data, such as height, or discreet data, such as mortality. The horizontal axis displays the limits that are used for each interval. For each interval a rectangular column centred on the midpoint is drawn reaching up from the horizontal axis. The vertical axis displays the number of values falling in each interval or, if desired, the percentage of values falling in each interval.
假設檢定不是顯示資料的方法。
Hypothesis testing is not a method for displaying data.
所以答案是選擇C: Histogram(直方圖)
參考文獻
改編自:BMJ Statistical Question 與「醫學論文與統計分析」
延伸學習資源
以下是與本篇「連續性變項資料呈現」相關的優質學習資源,幫助您深入理解描述統計方法。
2026年課程與工作坊
3月
- 線上 3/1起:e26-01 Zotero(+AI) 知識管理
- 實體 3/14(五):F26-01 AI 助力論文選題
- 直播 3/20(四):Live26-03 因果思維
4月
- 直播 4/10(五):Live26-04 DAG 一畫就知道
![]()
數據串接與清洗
數據是礦藏,數據清洗是挖出鑽石的第一步,尤其是巨量知識。數據清洗或串接執行過程需要細心與專注,且有可能會消耗許多時間和精力,就由我們來替各位處理掉這個大麻煩。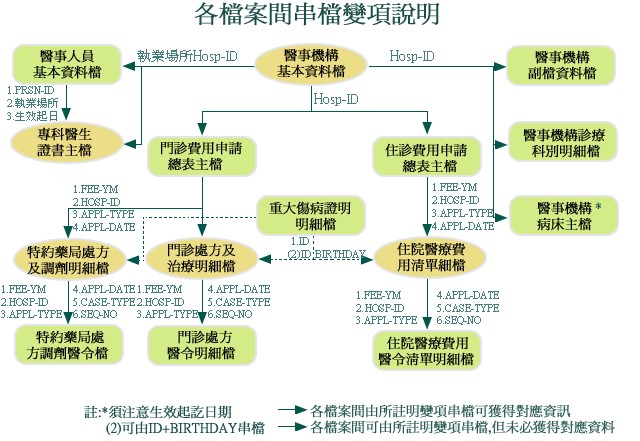
全民健保研究資料庫、國外大型資料庫資料非常齊全,種類多,需要串接與清洗,進行正規化後才能更進一步進行資料探勘與統計分析。
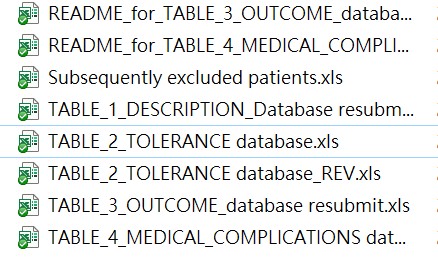
Fig1.同一個Project資料散落在不同tables,無法使用
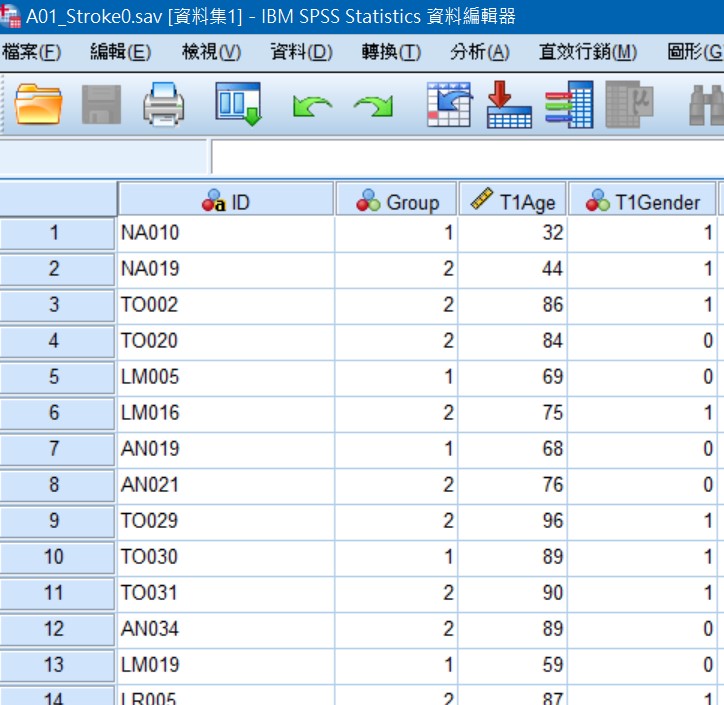
Fig2.整併與清理為可分析的table
Fig.3整理和分析後形成有意義的知識
概念與流程示意圖
![]()
教育培訓
課程規劃核心為以「學習者」為中心進行「傳承」
以學習者為中心,結合陳秀敏博士十多年來的統計實務以及教學經驗,設計適合學員學習方式,開設課程,達到有效學習。
開設線上統計學院
SPSS基礎統計實戰班:第一次分析SCI研究就上手(上、下)
課程網址:https://medata.teaches.cc/
課程介紹1:https://www.youtube.com/watch?v=MPz2wqN0v2M
課程介紹2:https://www.youtube.com/watch?v=nd5A5duxO5E
臨床研究思維-Open your mind
課程網址:https://medata.teaches.cc/
課程介紹1:https://www.youtube.com/watch?v=yTHdBnCdSnY
課程介紹2 : https://www.youtube.com/watch?v=kE9tXraICqk
![]()
計畫撰寫與統計諮詢

為了讓匯東華的顧客與學員有更好的合作和消費體驗,故匯東華特別依據營業項目開發周邊產品,提供使用、購買。目前已有針對公共衛生師的題庫以及模擬試題,未來將針對醫學研究領域發展產品。