![]() 匯東華統計顧問有限公司
匯東華統計顧問有限公司
"匯東華-認真作好每件事"
~統計,不再是阻力,而是助力~
![]()
BMJ小小統計問題(18):The log rank test
前言:
已經連續六周的存活分析周,針對存活分析相關概念進行介紹與說明。本周則介紹最常用來比較不同組別存活時間是否有差異的log rank test。裡面所提到的概念,相信這幾周看下來後,會發現都很熟悉了。過幾天會彙整這幾周存活分析概念的測驗題,有興趣的朋友到時可以試試。
問題:
前面的統計問題描述了存活(time to event)資料[1,2]。所使用的例子是一項隨機對照試驗,該試驗評估了與常規照護相比,整合照護方案在促進慢性下腰痛病人重返工作崗位的有效性[3]。整合照護方案是一個直接結合病人和工作場所之介入計畫。
試驗參與者為年齡在18到65歲之間的成年人,他們腰痛超過12周,並在有支薪的工作有缺席。主要結果是休假時間,即從隨機分配後到完全持續返回工作的期間。
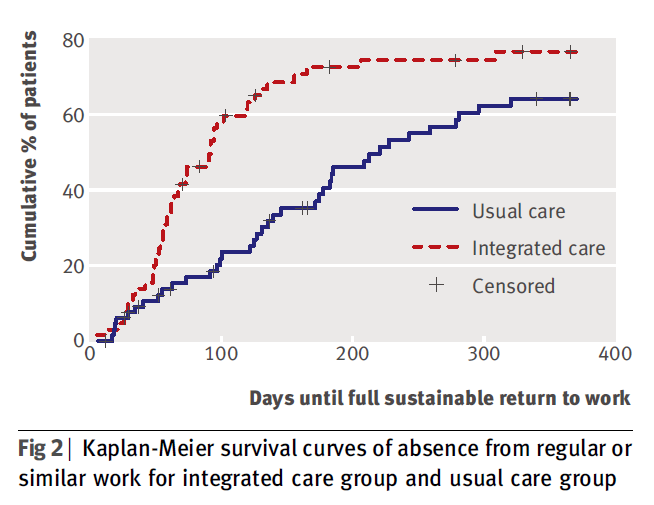
參與者被追蹤12個月。兩組病人的存活(time to event)資料採用log rank test進行統計比較(P=0.003)。整合照護組和常規照護組在完全持續恢復工作前的天數被繪製為Kaplan-Meier存活曲線,如下圖。
下列敘述何者正確? (複選)
a) The log rank test有助於檢驗虛無假設——在這種情況下,整合照護方案和常規照護之間的母群體群存活時間沒有差異
b) 設限觀察值在介入組進統計比較前,已被剔除
c) 在5%顯著水準上,介入組別間的存活時間存在統計學上的顯著差異
d) The log rank test提供不同介入方案組間存活時間差異的估計值
答案:
a、c正確,b、d錯誤
詳細說明:
The log rank test是一種用來比較兩組別存活時間的統計檢定法。”存活時間”為個體到達終點所需要的時間。在上述研究中,終點是在因慢性下背痛缺勤後到完全返回工作的期間。與傳統假設檢定一樣,the log rank test是從虛無假設開始,在所獲得樣本的母群體中,參加整合照護方案者和接受常規照護者在存活時間上沒有差異 (a正確)。對立假設是雙尾的,為組別間有差異存在的陳述——在所獲得樣本的母群體中,接受兩種介入者的存活時間不相等。
The log rank test評估為期12個月的研究期間,兩種介入在任何時間點是否有差異。所有的存活時間均包含在分析中,包括精確的和設限的時間(b錯誤)。設限存活時間提供了設限時間點的有用訊息,因此,被包括在存活曲線的計算以及不同治療組別的統計比較中。
統計假設檢驗的傳統顯著水準為0.05(即5%),稱為臨界顯著水準[5]。The log rank test的結果P值為0.003。考慮到該值小於0.05,結果在5%顯著水準下具有統計意義(c正確)。因此,我們拒絕虛無假設,接受對立假設,並得出結論,兩種介入的存活時間不相等。由此數字可看出,整合照護組整體的存活時間比常規照護組短。
The log rank test 純粹是對顯著性的檢驗。它無法估計不同介入組別間存活時間差異的大小(d錯誤)。風險比值(hazard ratio)可能是提供兩介入組間存活時間差異幅度估計值的最常用方法。
Reference:
[1] Sedgwick P. Survival (time to event) data I. BMJ2010;341:c3537.
[2] Sedgwick P. Survival (time to event) data II. BMJ2010;341:c3665.
[3] Lambeek LC, van Mechelen W, Knol DL, Loisel P, Anema JR. Randomised controlled trial of integrated care to reduce disability from chronic low back pain in working and private life. BMJ2010;340:c1035.
[4] Sedgwick P. Statistical hypothesis testing. BMJ2010;340:c2059.
[5] Sedgwick P. P values. BMJ2010;340:c2203.
https://www.bmj.com/content/341/bmj.c3773
想系統性學好存活分析?
從 Kaplan–Meier 存活曲線、設限與風險比(Hazard Ratio),到 Cox 迴歸與競爭風險模型,匯東華統計學院提供從理論到 SPSS/R 實作的完整課程。相關文章、課程與 BMJ 系列都彙整在存活分析合輯。
![]()
數據串接與清洗
數據是礦藏,數據清洗是挖出鑽石的第一步,尤其是巨量知識。數據清洗或串接執行過程需要細心與專注,且有可能會消耗許多時間和精力,就由我們來替各位處理掉這個大麻煩。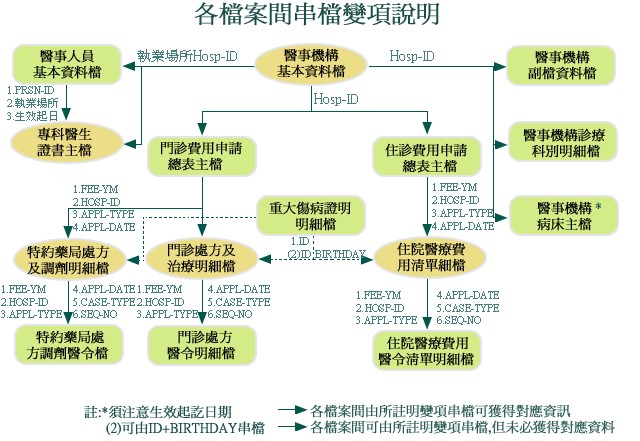
全民健保研究資料庫、國外大型資料庫資料非常齊全,種類多,需要串接與清洗,進行正規化後才能更進一步進行資料探勘與統計分析。
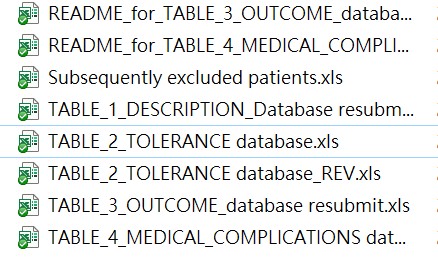
Fig1.同一個Project資料散落在不同tables,無法使用
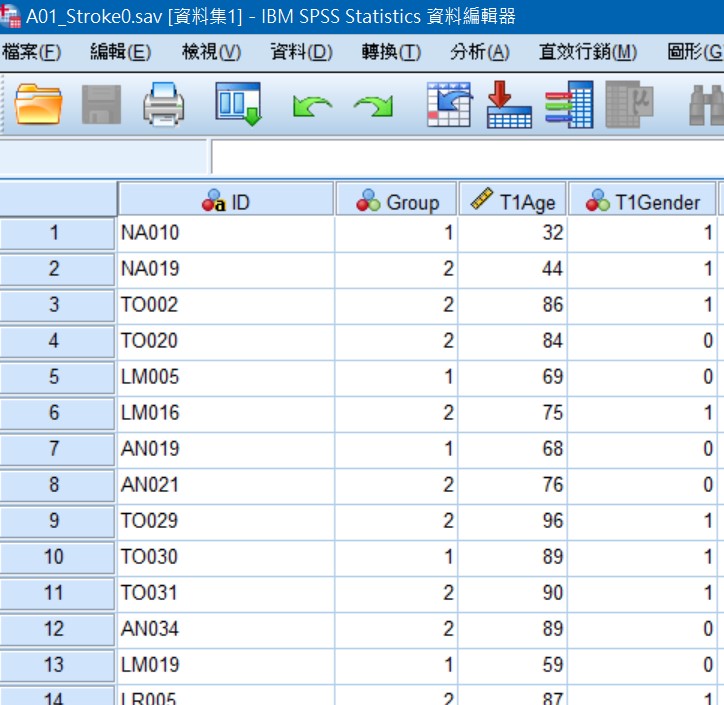
Fig2.整併與清理為可分析的table
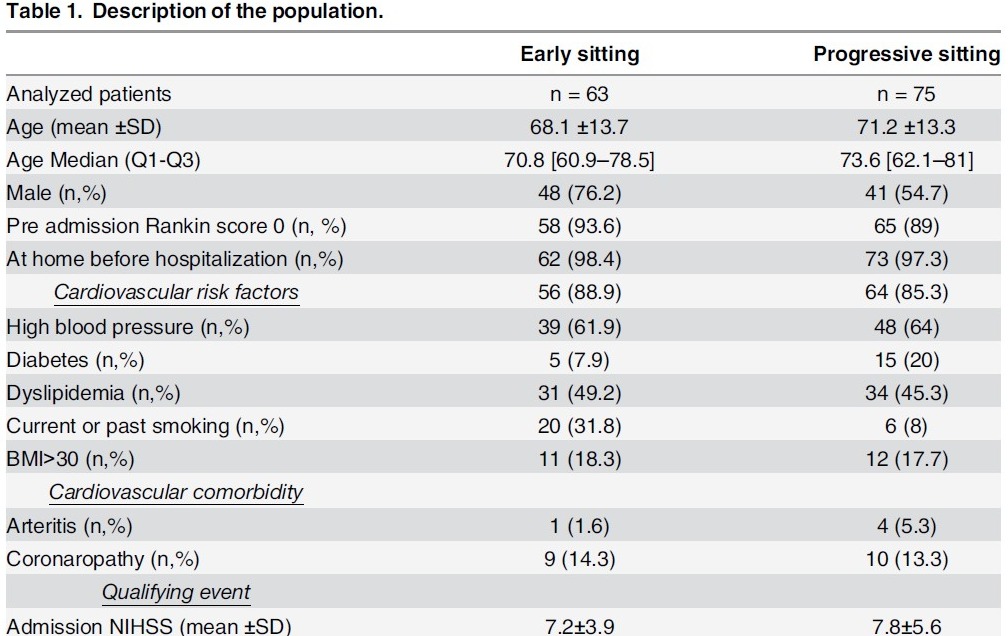
Fig.3整理和分析後形成有意義的知識
概念與流程示意圖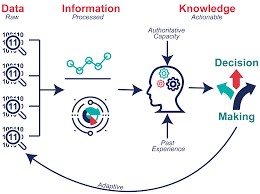
![]()
教育培訓
課程規劃核心為以「學習者」為中心進行「傳承」
以學習者為中心,結合陳秀敏博士十多年來的統計實務以及教學經驗,設計適合學員學習方式,開設課程,達到有效學習。
開設線上統計學院
SPSS基礎統計實戰班:第一次分析SCI研究就上手(上、下)
課程網址:https://medata.teaches.cc/
課程介紹1:https://www.youtube.com/watch?v=MPz2wqN0v2M
課程介紹2:https://www.youtube.com/watch?v=nd5A5duxO5E
臨床研究思維-Open your mind
課程網址:https://medata.teaches.cc/
課程介紹1:https://www.youtube.com/watch?v=yTHdBnCdSnY
課程介紹2 : https://www.youtube.com/watch?v=kE9tXraICqk
![]()
計畫撰寫與統計諮詢
為了讓匯東華的顧客與學員有更好的合作和消費體驗,故匯東華特別依據營業項目開發周邊產品,提供使用、購買。目前已有針對公共衛生師的題庫以及模擬試題,未來將針對醫學研究領域發展產品。